
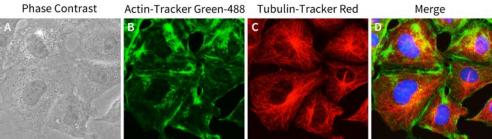
Figure 1. Staining effect of Tubulin Tracker Red on NRK-52E cells (rat renal tubular epithelial cells). Figure A shows the morphology of rat renal tubular epithelial cells under bright field conditions; The green fluorescence represents microfilaments stained with Actin Tracker Green-488 (Figure B), the red fluorescence represents microtubules stained with Tubulin Tracker Red (Figure C), and Figure D shows the overlay of triple staining of Tubulin Tracker Red, Actin Tracker Green-488, and Hoechst 33342. The measured data may vary due to differences in experimental conditions, testing instruments, etc. The data in the figure is for reference only.
Tubulin-Tracker Red
Ship worldwide. Contact order@enogene.com for ordering and bulk pricing or contact your local distributor.

Categories by research area
Categories by product type
- Antibodies
- Primary Antibodies
- Tag antibodies
- Internal control antibodies
- Pathological (Immunohistochemistry, IHC) antibodies
- Cell Signal Transduction Research Antibodies
- Secondary Antibody
- Antibody Sampler Kits
- ELISA Kits
- Recombinant Proteins
- Fluorescence Reagents
- Signal Inhibitors and Activators
- Transfection Reagent
- Cell biology kits
- Overexpression Cell Lines
- Cell Lysates
- Purification Resins
- 2019-nCoV & Monkeypox