World supplier of antibodies, antigens and kits since 2007

Figure 1. Schematic diagram of the assay
ELISA Kits
Human EGF ELISA Kit
$833/ 96T
QuantityTotal: $833
Ship worldwide. Contact order@enogene.com for ordering and bulk pricing or contact your local distributor.
Price833$
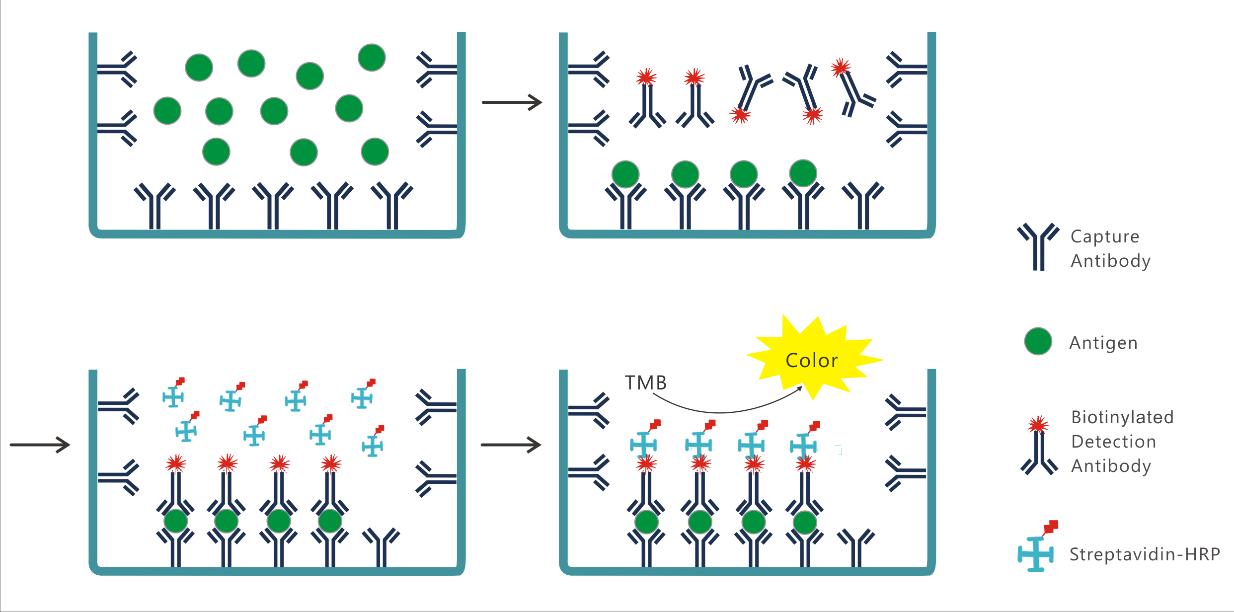
Figure 1. Schematic diagram of the assay
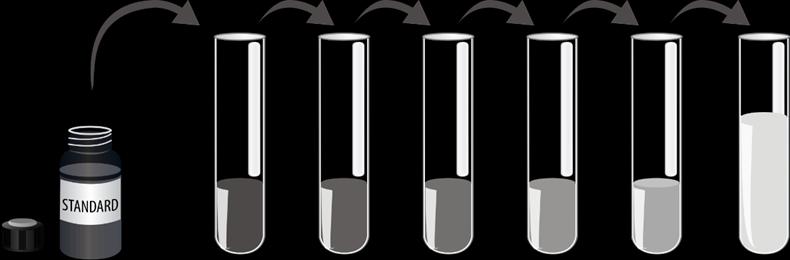
900μl 500μl 500μl 500μl 500μl 500μl 2000 2000 1000 500 250 125 62.5 0 pg/ml pg/ml pg/ml pg/ml pg/ml pg/ml pg/ml Figure 2. Preparation of EGF standard dilutions For Research Use Only 5
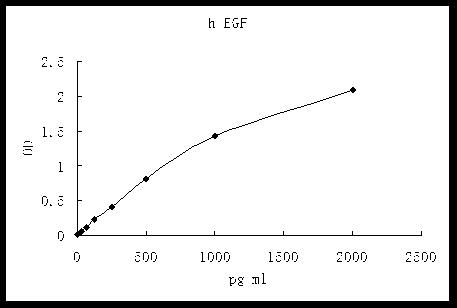
Figure 4. Representative standard curve for human EGF ELISA. use this standard curve to derive test results. A standard curve must be run for microwell strips assayed.

Categories by research area
Categories by product type
- Antibodies
- Primary Antibodies
- Tag antibodies
- Internal control antibodies
- Pathological (Immunohistochemistry, IHC) antibodies
- Cell Signal Transduction Research Antibodies
- Secondary Antibody
- Antibody Sampler Kits
- ELISA Kits
- Recombinant Proteins
- Fluorescence Reagents
- Signal Inhibitors and Activators
- Transfection Reagent
- Cell biology kits
- Overexpression Cell Lines
- Cell Lysates
- Purification Resins
- 2019-nCoV & Monkeypox